Data Widgets are ideally for visualizing your data. They empower you to create dashboards in which you can keep track on all your important machine data at a glance. Moreover, they can help you to identify trends or to compare and combine different variables.
This article will provide you with information about how the different data widgets work and how they can be configured to fit your needs.
Which data widgets are available?
If you would like to learn more about a specific widget, please click on the corresponding widget icon.
How do I configure a Pareto widget?
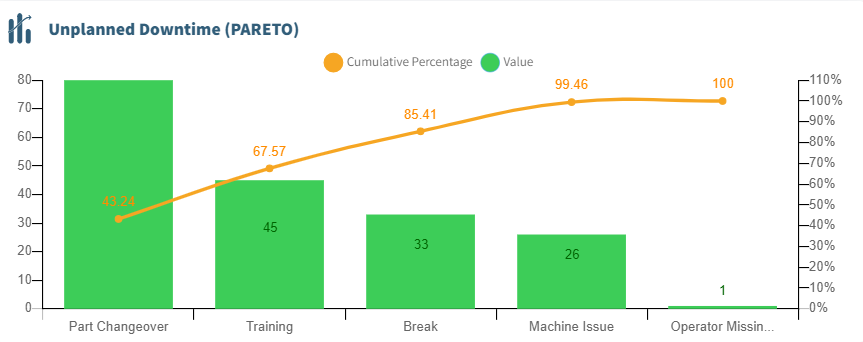
Pareto Widget
The individual values of the variables are represented by the bars in a descending order. Furthermore, the line graph symbolizes the cumulative sum.
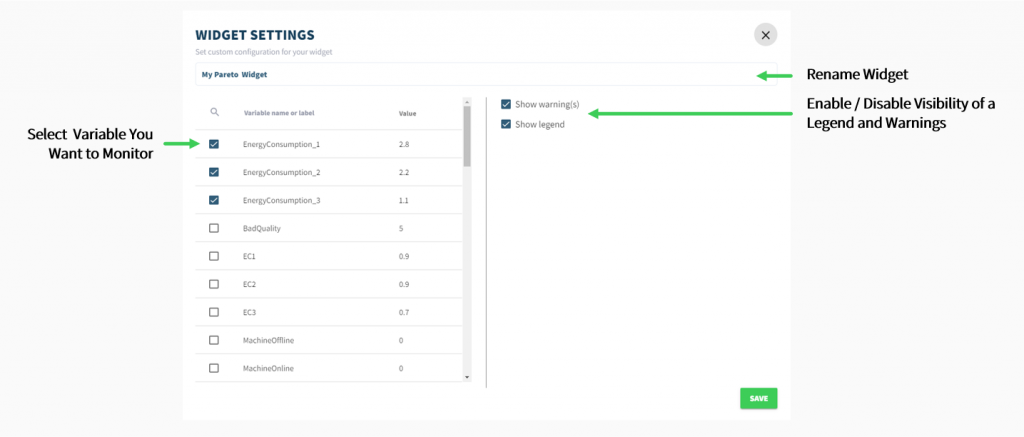
To configure a Pareto widget please follow the following steps:
1. rename widget
2. select variable you want to monitor (maximum 15 variables)
3. enable or disable visibility of a legend and warnings
warning: widget signalizes warning as soon as warning is triggered
4. click Save
How do I set up a Gauge widget?
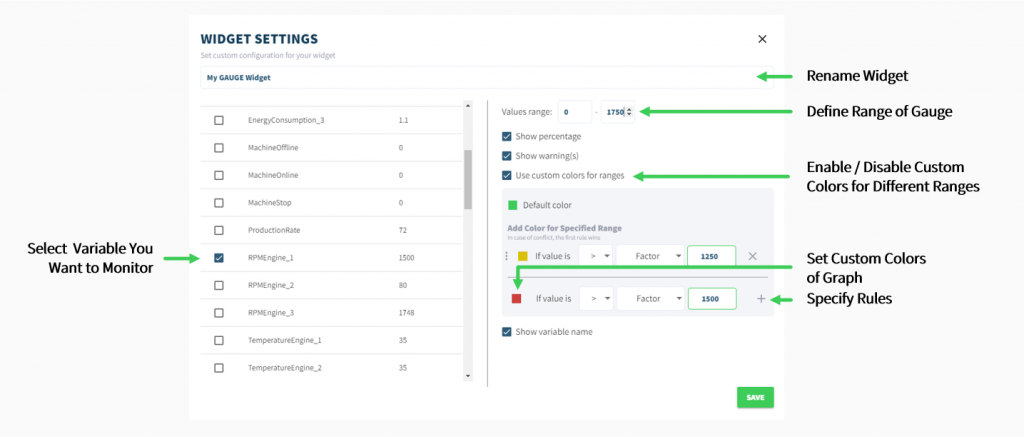
To set up a Gauge widget please follow the following steps:
1. rename widget
2. select variable you want to monitor
3. define range for gauge
4. enable or disable custom colors to indicate different ranges (optional)
Set Custom Color Ranges
1. select custom color
2. select operator for conditions
3. select a factor or another variable which should be compared with value of variable via drop-down menu
4. click “+”
5. enable or disable visibility of variable name, value in percentage and warnings
warning: widget signalizes warning as soon as warning is triggered
6. click Save
How do I set up a Last States widget?
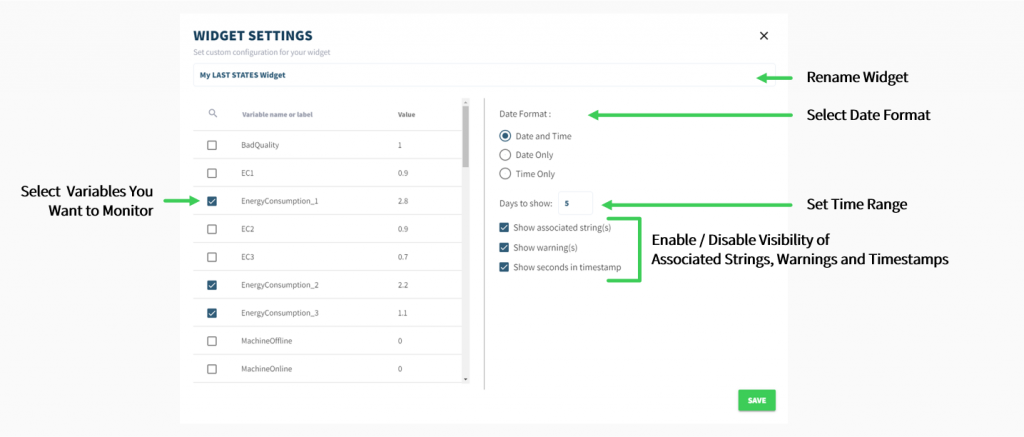
To set up a Last States widget please follow the following steps:
1. rename widget
2. select variables you want to monitor (up to 3 variables)
If you select multiple variables for a Last States widget, the values will be displayed in a table.
3. set date format
Date Formats:
– Date and Time (up to the minute)
– Date Only
– Time Only (up to the minute)
4. set time range you want to monitor (max. last 180 days)
5. enable or disable visibility of associated strings, second time stamps and warnings
associated strings: widget displays text which was set associated strings
warning: widget signalizes warning as soon as warning is triggered
6. click Save
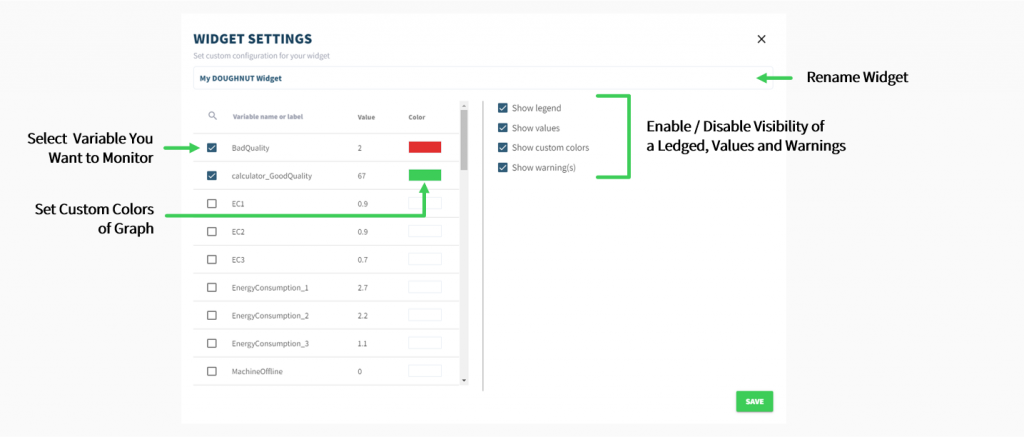
How do I configure a Doughnut widget?
To configure a Doughnut widget please follow the following steps:
1. rename widget
2. select variable you want to monitor (maximum 20 variables)
3. enable or disable custom colors for doughnut chart
4. set custom colors (optional)
5. enable or disable visibility of a legend, values or warnings
warning: widget signalizes warning as soon as warning is triggered
6. click Save
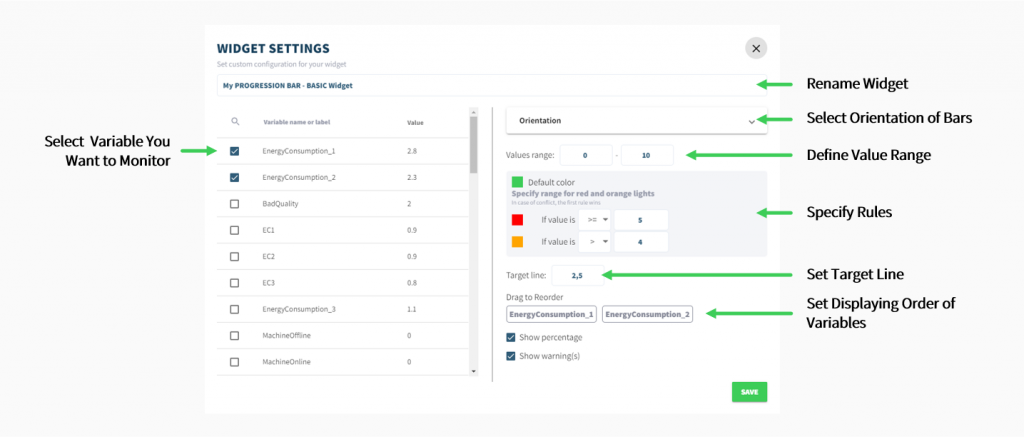
How do I configure a Progression Bar – BASIC widget?
To configure a Progression Bar – BASIC widget please follow the following steps:
1. rename widget
2. select variable you want to monitor (maximum 15 variables)
3. set orientation of bars – horizontal or vertical
4. define value range
5. enable or disable custom colors to indicate different ranges (optional)
Set Custom Color Ranges
1. select custom color
2. select operator for conditions
3. select a factor or another variable which should be compared with value of variable via drop-down menu
4. click “+”
6. define target line (optional)
7. order display sequence of variables according to your needs (if more than 1 variable is monitored)
8. enable or disable value in percentage and warnings
warning: widget signalizes warning as soon as warning is triggered
9. click Save
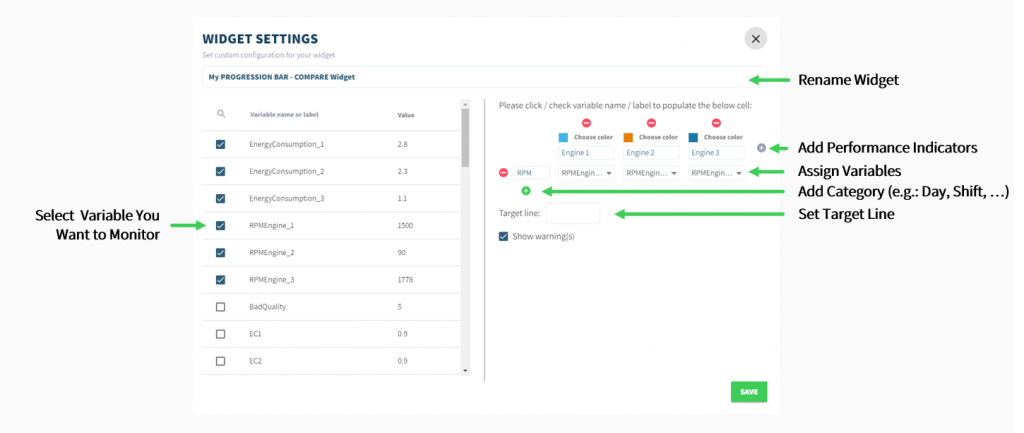
How do I configure a Progression Bar – COMPARE widget?
To configure a Progression Bar – COMPARE widget please follow the following steps:
1. rename widget
2. select variable you want to monitor (maximum 15 variables)
3. add performance indicators you want to monitor
4. set custom colors for bars (optional)
5. add categories (e.g.: day, shift, …)
6. assign selected variables to performance indicators
7. define target line (optional)
8. enable or disable visibility of warnings
warning: widget signalizes warning as soon as warning is triggered
9. click Save
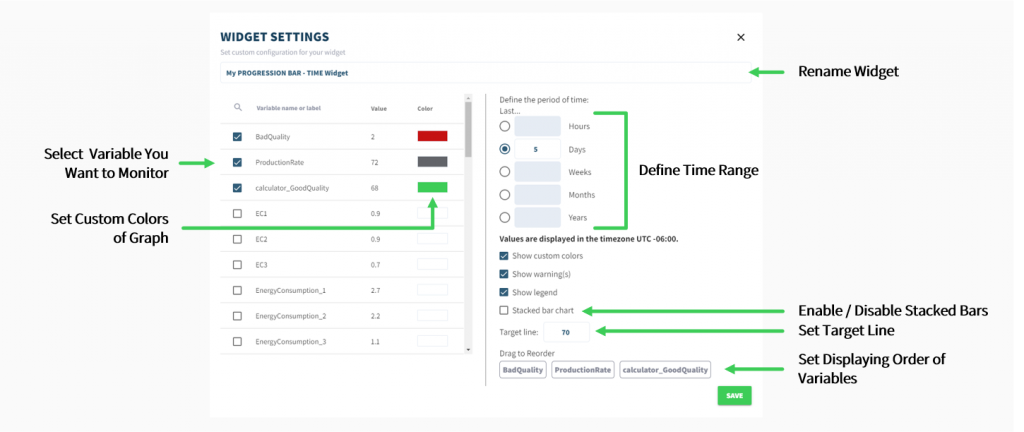
How do I configure a Progression Bar – TIME widget?
To configure a Progression Bar – TIME widget please follow the following steps:
1. rename widget
2. select variable you want to monitor (at least 1 variables / maximum 6 variables)
3. select time period for which you want to monitor
values are displayed based on machine time (can be set in Monitor: Config)
4. enable or disable custom colors for chart
5. set custom colors (optional)
6. enable or disable visibility of legends or warnings
warning: widget signalizes warning as soon as warning is triggered
7. enable or disable stacked bar chart
8. define target line (optional)
9. order display sequence of variables according to your needs (if more than 1 variable is monitored)
10. click Save
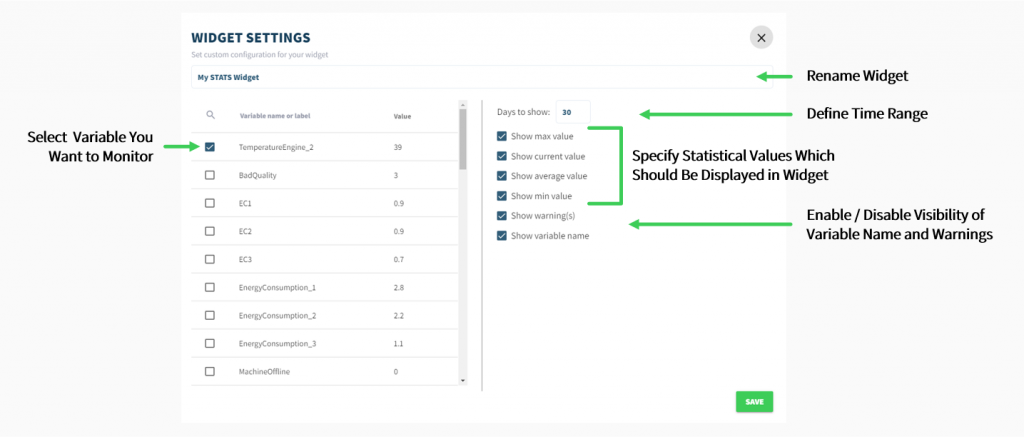
How do I set up a Stats widget?
To set up a Stats widget please follow the following steps:
1. rename widget
2. select variable you want to monitor
3. select time period for which you want to calculate and display the statistical values (max. last 180 days)
4. select statistical values you want to calculate and display in widget
5. enable or disable visibility of variable’s name or warning (can be set in value page)maximum value
current
value
average
value
minimum
value
maximum
value
6. click Save
How do I set up a Thermometer widget?
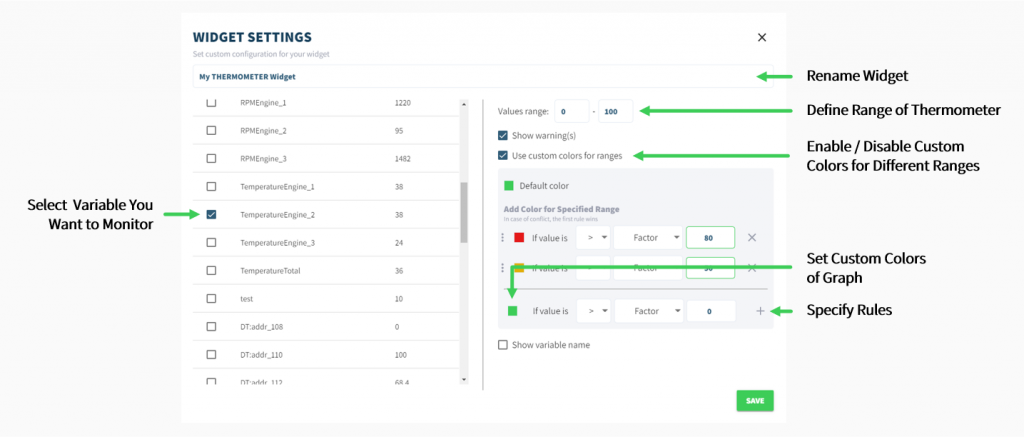
To set up a Thermometer widget please follow the following steps:
1. rename widget
2. select variable you want to monitor
3. define range of thermometer
4. enable or disable custom colors to indicate different ranges (optional)
Set Custom Color Ranges
1. select custom color
2. select operator for conditions
3. select a factor or another variable which should be compared with value of variable via drop-down menu
4. click “+”
5. enable or disable visibility of variable’s name or warning (can be set in value page)
variable name: widget displays variable’s label
warning: widget signalizes warning as soon as warning is triggered
6. click Save
How do I configure a Traffic Light widget?
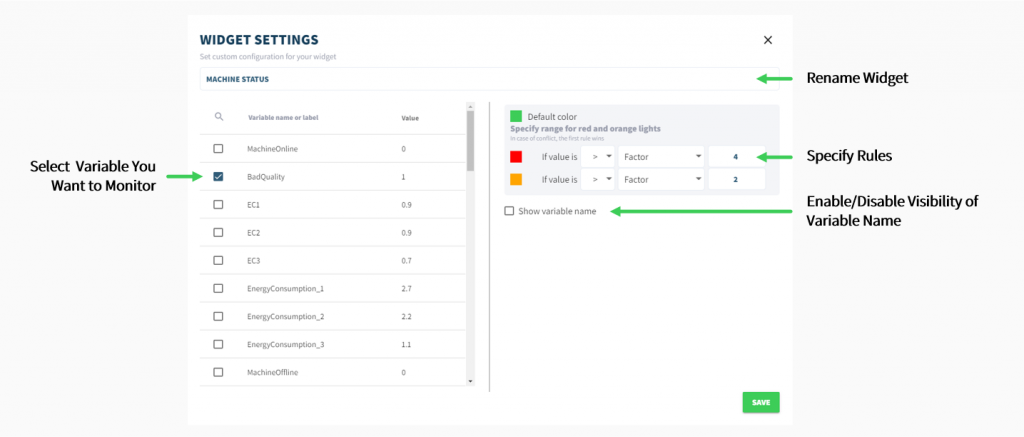
To configure a Traffic Light widget please follow the following steps:
1. rename widget
2. select variable you want to monitor
3. select operator for conditions (red and orange light)
4. select a factor or another variable which should be compared with value of variable via drop-down menu
5. enable or disable visibility of variable name
variable name: widget displays variable’s label
6. click Save
How do I configure a Trend widget?
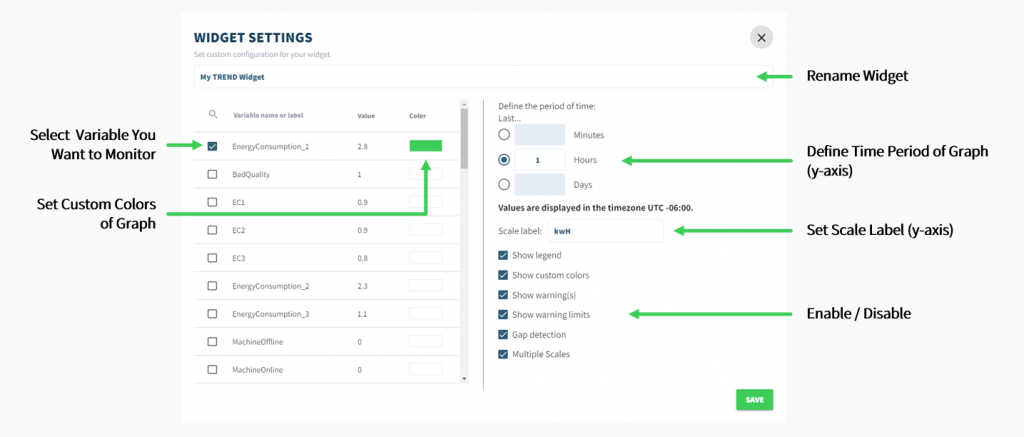
To configure a Trend widget please follow the following steps:
1. rename widget
2. select variable you want to monitor (at least 1 variables / maximum 2 variables)
3. select time period for which you want to display the trend
values are displayed based on machine time (can be set in Monitor: Config)
– days: max. last 180 days
– hours: max. last 24 h
– minutes: max. last 60 min
4. enable or disable custom colors for graph
5. set custom colors (optional)
6. enable or disable visibility of legends, multiple scales, gab detection or warning limits
gab detection: Machine Advisor highlights position in graph, where no data is available
warning limits: lines indicate limits based on variable’s warning setting on value page
7. click Save
How do I set up a Value widget?
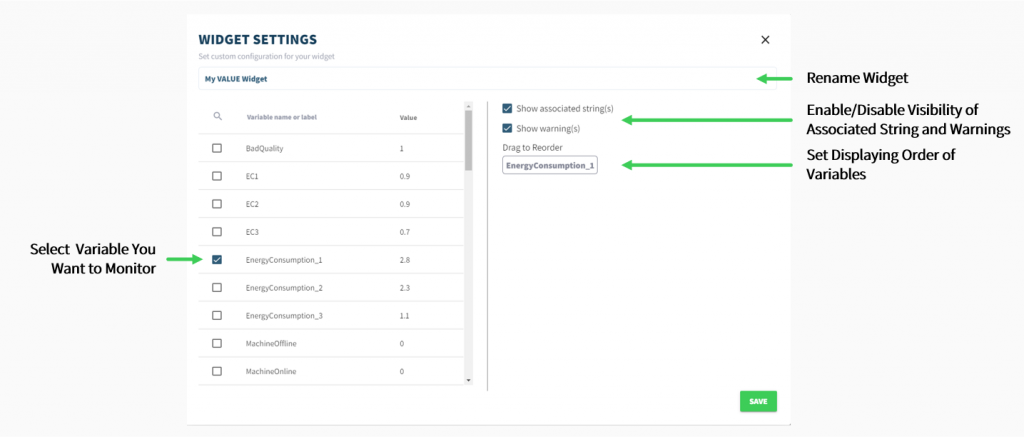
To set up a Value widget please follow the following steps:
1. rename widget
2. select variable you want to monitor (at least 1 variables / maximum 15 variables)
3. enable or disable visibility of associated strings or warning (can be set in value page)
associated strings: widget displays text which was set associated strings
warning: widget signalizes warning as soon as warning is triggered
4. order display sequence of variables according to your needs (if more than 1 variable is monitored)
5. click Save
